Thursday, June 30, 2011

Chapter 54: Performing Quantitative Analysis

Though we have done the Qualitative Analysis in the previous chapter, we are not complete. We still need to do Quantitative Analysis.

Quantitative risk analysis is generally performed on risks that have been prioritized by using the qualitative risk analysis. However, depending upon the experience of the team and their familiarity with the risk, it is possible to skip the qualitative risk analysis and, after the risk identification, move directly to the quantitative risk analysis. The quantitative risk analysis has three major goals:
• Assess the probabilities of achieving specific project objectives
• Quantify the effect of the risks on the overall project objectives
• Prioritize risks by their contributions to the overall project risk

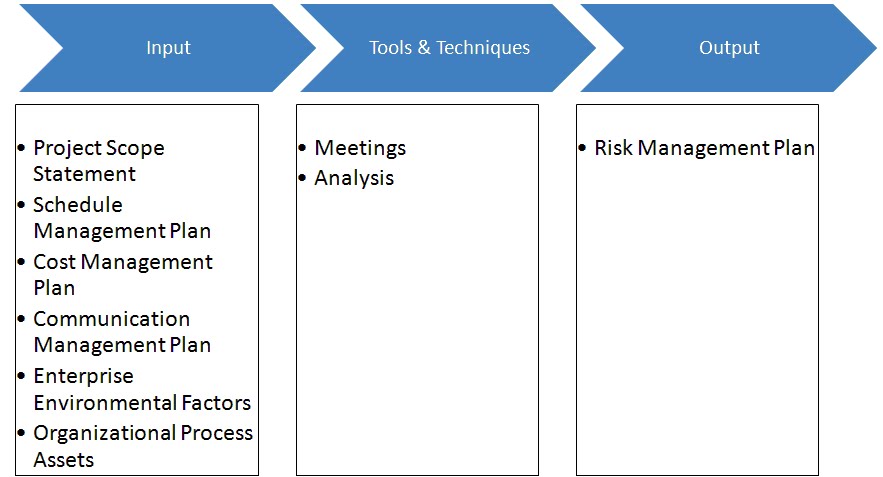
The image below explains the process more clearly.


Input to Quantitative Analysis

All the items that are input for the qualitative risk analysis are also input for the quantitative risk analysis. In addition, the quantitative risk analysis generally requires more information than its qualitative counterpart. The list of inputs for this process are:
Risk register - The key input items from the risk register are the following:
o List of identified risks
o Priority list of risks if the qualitative risk analysis was performed
o Risks with categories assigned to them
o Management plans - To perform quantitative risk analysis, you must look at the risk management plan, cost management plan, and schedule management plan. To generate the output of the quantitative risk analysis, you need the following elements of the risk management plan:
 Budgeting
 Definitions of probabilities and impacts
 Probability and impact matrix
 Risk categories
 Risk timing and scheduling
To analyze the effect of risks on the project objectives, you need to know the project schedule and the project cost. These can be found in the cost management plan and schedule management plan. Also, the approaches taken by these plans can affect quantitative risk analysis.
Organizational process assets - The following organizational process assets might be useful in the quantitative analysis:
o Information on previously performed similar projects
o Studies performed by risk specialists on similar projects
o Proprietary risk databases or risk databases available from the industry

Tools and Techniques for Quantitative Analysis

The quantitative risk analysis can be looked upon as a two-step process; gathering and representing the data, and analyzing and modeling the data. Accordingly, all the techniques fall into two categories: data gathering and representation techniques, such as interviewing, probability distributions, and expert judgment; and analysis and modeling techniques, such as sensitivity analysis, EMV analysis, decision tree analysis, and modeling and simulation. We shall be covering them one by one in the list below:

Interviewing - This technique is used to collect the data for assessing the probabilities of achieving specific project objectives. You are looking for results such as: We have a 70% probability of finishing the project within the schedule desired by the customer. Or: We have a 60% probability of finishing the project within the budget of Rs. 100,000. The goal is to determine the scale of probabilities for a given objective; for example, there is a 20% probability that the project will cost Rs. 50,000, a 60% probability that it will cost Rs. 100,000, and a 20% probability that it will cost Rs. 150,000.

The data is collected by interviewing relevant stakeholders and subject matter experts. Most commonly, you will be exploring the optimistic (best case), pessimistic (worst case), and most likely scenarios for a given objective.

Probability distributions - After you have collected the data on meeting the project objectives, you can present it in a probability distribution for each objective under study. Note that a distribution represents uncertainty, and uncertainty represents risk. For example, if you know for sure the project will cost Rs. 25 lakhs, there will be no distribution because it is only one data point. Distribution comes into the picture when you have several possible values with a probability assigned to each value. There are distributions of different shapes in which the data can be presented.


Look at the picture above. This example is for the cost objective. The X axis represents the cost, and the Y axis represents the corresponding probability that the project will be completed within that cost.

The beta distribution and the triangular distribution are the most frequently used distributions. The other commonly used distributions that could be suitable under given circumstances are normal distribution and uniform distribution. The uniform distribution is used when all the values of an objective have the same chance of being true.

Sensitivity analysis - This is a technique used to determine which risk has the greatest impact on the project. You study the impact of one uncertain element on a project objective by keeping all other uncertain elements fixed at their baseline values. You can repeat this analysis for several objectives, one at a time. You can also repeat this study for several uncertain elements (creating risks), one element at a time. This way, you can see the impact of each element (or risk) on the overall project separate from other elements (or risks).

Expected monetary value analysis - The expected monetary value (EMV) analysis is used to calculate the expected value of an outcome when different possible scenarios exist for different values of the outcome with some probabilities assigned to them. The goal here is to calculate the expected final result of a probabilistic situation. EMV is calculated by multiplying the value of each possible outcome by the probability of its occurrence and adding the results. For example, if there is 60% probability that an opportunity will earn you Rs. 1,000 and a 40% probability that it will only earn you Rs. 500, the EMV is calculated as follows:

EMV = 0.60×1000 + 0.40×500 = 600 + 200= 800

So the EMV in this case is Rs. 800. When you are using opportunities and threats in the same calculation, you should express EMV for an opportunity as a positive value and EMV for a threat as a negative value. For example, if there is a 60% chance that you will benefit from a risk by Rs. 1,000 and a 40% probability that you will lose Rs. 500 as a result of this risk, the EMV is calculated as follows:

EMV = 0.60×1000 - 0.40×500 = 600 – 200 = 400

Therefore, the EMV in this case is Rs. 400.

The concept of EMV can be presented in a decision-making technique, such as a decision tree analysis.

Decision tree analysis - This technique uses the decision tree diagram to choose from different available options; each option is represented by a branch of the tree. This technique is used when there are multiple possible outcomes with different threats or opportunities with certain probabilities assigned to them. EMV analysis is done along each branch, which helps to make a decision about which option to choose.

Look at the image below. It is a simple decision tree.


The decision tree diagram above depicts two options: updating an existing product or building a new product from scratch. The initial cost for the update option is Rs. 500,000, whereas the initial cost for the build-from-scratch option is Rs. 700,000. However, the probability for failure is 25% for the update option, compared to 10% for the build-from-scratch option, and the impact from failure for case 1 is Rs. 1.25 lakhs whereas for the other it is only Rs. 70,000. In such a situation, the build from scratch may be chosen because, even though it costs more, the chances of failure as well as losses in case of a failure are lower than the update option.

Modeling and simulation - A model is a set of rules to describe how something works; it takes input and makes predictions as output. The rules might include formulas and functions based on facts, assumptions, or both. A simulation is any analytical method used to imitate a real-life system. Simulations in risk analysis are created using the Monte Carlo technique, which is named after the city of Monte Carlo; known for its casinos that present games of chance based on random behavior. Monte Carlo simulation models take random input iteratively to generate output for certain quantities as predictions. This technique is used in several disciplines, such as physics and biology, in addition to project management. In risk analysis, the input is taken randomly from a probability distribution, and the output for impact on the project objectives is predicted. The name “Monte Carlo” refers to the random behavior of the input.
Expert judgment - In quantitative risk analysis, expert judgment can be used to validate the collected risk data and the analysis used for the project at hand.

Output of the Quantitative Risk Analysis: Updated Risk Register

As with the Qualitative Analysis, the output of this process too is the updates to the Risk Register. The updates include:
Probabilistic analysis of the project - This includes the estimates of the project schedule and cost with a confidence level attached to each estimate. Confidence level is expressed in percentage form, such as 95%, and it represents how certain you are about the estimate. You can compare these estimates to the stakeholders’ risk tolerances to see whether the project is within the acceptable limits.
Probability of achieving the project objectives - Factoring in project risks, you can estimate the probability of meeting project objectives, such as cost and schedule, set forth by the current project plan. For example, the likelihood of completing the project within the current budget plan of Rs. 2 lakhs is 70%.
Prioritized list of risks - Risks are prioritized according to the threats they pose or the opportunities they offer. Risks with greater threats (or opportunities) are higher on the list. The goal is to prioritize the response plan efforts to eliminate (or minimize) the impact of the threats and capitalize on the opportunities. The priorities are determined based on the total effect of each risk to the overall project objectives.
Trends in the results - By repeating the analysis several times and examining the results, you might recognize a trend for specific risks. That trend might suggest further analysis or a specific risk response. In finding the trend, you can also take a look at the historical information on project cost, quality, schedule, and performance.

Prev: Performing Qualitative Analysis

Next: Planning Risk Response

Chapter 53: Performing Qualitative Analysis

Qualitative Analysis is the first step towards analyzing the risks that have been identified in the risk identification process. The qualitative analysis process is quick and cheaper. It gives you some feel about the risks, and then you can determine which risks needs to be analyzed further by using quantitative analysis.

The perform qualitative risk analysis process is shown as a picture below:


Input to Qualitative Risk Analysis

The Risk Register is a default input to this process. Apart from the risk register, the other inputs to this process are:

Project scope statement - When you are performing qualitative risk analysis, you want to know what kinds of risks you are dealing with. For example, are you already familiar with these risks? If your project is similar to previous projects, it might have well-understood risks. If it is a new and complex project, it might involve risks that are not well understood in your organization. So, how do you know what kind of project you are dealing with? Simply put, you have to take a look at the project scope statement and search for uncertainties.
Risk management plan - To generate the output of qualitative risk analysis, you will need the following elements of the risk management plan:
• Roles and responsibilities for performing risk management
• Budgeting
• Definitions of probabilities and impacts
• The probability and impact matrices
• Risk categories
• Risk timing and scheduling
• Stakeholders’ risk tolerances

If any of these input items was not developed during risk management planning, it can be developed during qualitative analysis.

Risk register - The risk register contains the list of identified risks that will be the key input to the qualitative risk analysis. Updated risk categories and causes of risks can also be useful elements of the risk register, which can be used in the qualitative risk analysis.
Organizational process assets - While analyzing risks, you will make use of the risk-related components of the knowledge base from previous projects, such as data about risks and lessons learned. You can also look into risk databases that may be available from industry organizations and proprietary sources.

Tools and Techniques for Qualitative Risk Analysis

Prioritizing risks based on their probability of occurrence and their impact if they do occur is the central goal of qualitative risk analysis. Accordingly, most of the tools and techniques used involve estimating probability and impact.

Risk probability and impact assessment - Risk probability refers to the likelihood that a risk will occur, and impact refers to the effect the risk will have on a project objective if it occurs. The probability for each risk and the impact of each risk on project objectives, such as cost, quality, scope, and time, must be assessed. Note that probability and impact are assessed for each identified risk.

Methods used in making the probability and impact assessment include holding meetings, interviewing, considering expert judgment, and using an information base from previous projects.

A risk with a high probability might have a very low impact, and a risk with a low probability might have a very high impact. To prioritize the risks, you need to look at both probability and impact.

Assessment of the risk data quality - Qualitative risk analysis is performed to analyze the risk data to prioritize risks. However, before you do it, you must examine the risk data for its quality, which is crucial because the credibility of the results of qualitative risk analysis depend upon the quality of the risk data. If the quality of the risk data is found to be unacceptable, you might decide to gather better quality data. The technique to assess the risk data quality involves examining the accuracy, reliability, and integrity of the data and also examining how good that data is relevant to the specific risk and project for which it is being used.

Risk urgency assessment - This is a risk prioritization technique based on time urgency. For example, a risk that is going to occur now is more urgent to address than a risk that might occur a few months from now.

Probability and impact matrix - Risks need to be prioritized for quantitative analysis, response planning, or both. The prioritization can be performed by using a probability and impact matrix; a lookup table that can be used to rate a risk based on where it falls both on the probability scale and on the impact scale.

Look at the table below: RXY, where X and Y are integers that represent risks in the two-dimensional (probability and impact) space.

Probability Impact
0.00 0.05 0.15 0.25 0.35 0.45 0.55 0.65 0.75 0.90
0.20 R11 R12 R13 R14 R15 R16 R17 R18 R19
0.40 R21 R22 R23 R24 R25 R26 R27 R28 R29
0.60 R31 R32 R33 R34 R35 R36 R37 R38 R39
0.80 R41 R42 R43 R44 R45 R46 R47 R48 R49
This is how you read this matrix. R21 has a 40% probability of occurring and will have a 5% impact on the project. Similarly R49 has a 80% probability and will have a 90% impact on the project.

How to calculate the numerical scales for the probability and impact matrix and what they mean depends upon the project and the organization. However, remember the relative meaning: Higher value of a risk on the probability scale means greater likelihood of risk occurrence, and higher value on the impact scale means greater effect on the project objectives.

Each risk is rated (prioritized) according to the probability and the impact value assigned to it separately for each objective. Generally, you can divide the matrix in the table above into three areas; high-priority risks represented by higher numbers, such as R49, medium-priority risks represented by moderate numbers, such as R25, and low-priority risks represented by lower numbers, such as R12. However, each organization has to design its own risk score and risk threshold to guide the risk response plan.

Note that impact can be a threat (a negative effect) or an opportunity (a positive effect). You will have separate matrices for threats and opportunities. Threats in the high-priority area might require priority actions and aggressive responses. Also, you will want to capitalize on those opportunities in the high-priority area, which you can do with relatively little effort. Risks posing threats in the low-priority area might not need any response, but they must be kept on the watch list to ensure that you don't get any unwanted or unexpected surprises towards the end of the project.

Risk categorization - You defined the risk categories during the risk management planning and risk identification processes. Now you can assign the identified risks to those categories. You can also revisit the categorization scheme, such as RBS, that you developed for your project, because now you have more information about risks for the project. Categorizing risks by their causes often helps you develop effective risk responses.

Expert judgment - You may need expert judgment to assess the probability and impact of each risk. To find an expert, look for people who’ve had experience with similar projects in the not too distant past. While weighing the expert judgment, look for possible biases. Often experts are biased toward their area or idea.

Output of the Qualitative Risk Analysis: Updated Risk Register

The risk register was initiated during the Identify Risks process and is updated with the results from the qualitative risk analysis. The updates will be:
Risks categorizations - This means arranging risks in different categories. This helps you identify the common root causes of the risks and the areas of the project that might require special attention. Furthermore, categorizing risks can bring order to a chaotic situation and makes the management of these risks easier and more effective.
Prioritized list of risks - The risk register has lists of risks prioritized according to the probability and impact matrix discussed earlier in this article. A separate list can be created for each project objective, such as cost, quality, scope, and time. These lists help you prioritize efforts for preparing and executing risk responses. The risks may be ranked as high, medium, or low.
Lists of risks - Using some criteria, you can make different lists of risks for effective management. Following are some examples:
o List of risks with time urgency - This list includes urgent risks that require attention now or in the near future.
o Watch list of low-priority risks - This list contains risks that are deemed unimportant by the qualitative risk analysis but that need to be monitored continually.
o List of risks for additional analysis and response - This list includes risks that need further analysis, such as quantitative analysis or a response action.
Trends in the analysis results - By examining the results from the qualitative risk analysis, you might recognize a trend for specific risks. That trend might suggest further analysis or a specific risk response.

The main output of qualitative risk analysis is the prioritization of risks based on a probability and impact matrix for each objective. So each objective can have its own prioritized list of risks.

Qualitative risk analysis is a relatively quick and cost-effective way to prioritize risks for risk planning. It also lays the groundwork for the quantitative risk analysis if one is required for some of the identified risks.

Prev: Analyzing Risks

Next: Performing Quantitative Analysis

Chapter 52: Analyzing Risks

In the previous chapter, we learnt how to identify risks. Identifying risks is a big task and if we screw up this step, the results can be disastrous. However, if we follow all the guidelines as explained in the PMBOK, we can be certain that our risk identification process was done efficiently. The next step for us is to analyze these risks. We are going to learn exactly that in this chapter.

So, lets get started!!!

Analyzing Risks

Once the risks have been identified, you need to answer two main questions for each identified risk:
1. What are the odds that the risk will occur,
2. If it does occur, what will its impact be on the project objectives?

You get the answers by performing risk analysis.

There are two main forms of Risk Analysis:
1. Qualitative Risk Analysis &
2. Quantitative Risk Analysis

Qualitative Risk Analysis

This is used to prioritize risks by estimating the probability of the occurrence of a risk and its impact on the project.

Quantitative Risk Analysis

This is used to perform numerical analysis to estimate the effect of each identified risk on the overall project objectives and deliverables.

Usually, you prioritize risks by performing qualitative analysis on them before you perform quantitative analysis. We will learn both one by one in the subsequent chapters.

Prev: Identifying Risks

Next: Performing Qualitative Analysis

Chapter 51: Identifying Risks

In the previous chapter, we learnt that managing risks is a big and important task. But, in order to manage and mitigate risks, the first thing we need to do is to identify them. In this chapter, we are going to learn just that.

So, lets get started!!!

Identifying Risks

Risks are identified by using the risk identification process. An unidentified risk is a danger lurking out of your sight and waiting to attack the project. The significance of the risk identification process cannot be explained enough. Organizations have whole departments whose sole purpose is to identify and mitigate risks. I guess, this is enough to quantify how important risk management is to large organizations. Similarly, from the perspective of running a project as a project manager too, risk management is extremely important and to do that effectively, first you need to identify those risks.

You use the risk identification process to accomplish the following tasks:
• Identify which risks might affect the project at hand
• Document the characteristics of the identified risks in a document called the risk register

As with all process, the risk identification process too has a set of inputs, uses some tools & techniques and produces an output. It is explained in the picture below:


Input to Risk Identification

The risk management plan and the project scope baseline are obvious inputs to identifying risks. As in many other processes, the enterprise environmental factors and organizational process assets relevant to the project at hand must also be considered. The following are all the inputs that need to be considered in the risk identification process.

Project scope baseline - Assumptions in the project scope statement, an element of the scope baseline, are potential sources of uncertainty, hence the risk. Constraints pose a risk by presenting predetermined factors, such as hard deadlines and fixed costs, thereby posing questions such as, “What is the probability that we can meet this constraint with the available resources?”

The WBS, another component of the scope baseline, can be used to recognize risks at different levels of the WBS hierarchy.

Management plans - In the process of identifying risks, you need to look at the cost management plan, schedule management plan, risk management plan, and quality management plan. The approach that any of these plans takes may pose some risks of its own or may enhance some other risks. The key items from the risk management plan useful for risk identification are risk categories, roles and responsibilities, and the budget and timing available for the risk management activities.

Cost and duration estimates - Estimates such as activity cost estimates and activity duration estimates by definition have a degree of uncertainty built into them. They should be looked at carefully to identify the potential risks hiding behind this uncertainty.
Stakeholder register - If you look at the stakeholder register, you might find some stakeholders who can give useful input to identifying risks.

Enterprise environmental factors - The environmental factors internal or external to the performing organization that can influence the project must be considered in the risk identification process. This might include academic and industry studies, published information, benchmarking, and commercial databases.

Organizational process assets - This might include information from previous projects including lessons learned, process controls, and risk-related templates.

Tools and Techniques for Risk Identification

Risk identification is crucial to risk management. If you fail to identify a risk, you will not be able to manage it. Having all these inputs is fine, but the key to the whole process is to identify the risks properly. The tools and techniques we use in this process are:

Assumptions analysis - Assumptions in the project scope statement represent uncertainty. You analyze these assumptions to identify the risks. Assumptions analysis is the technique used to examine the validity of the assumptions and thereby to identify the risks resulting from the inaccuracies, inconsistencies, or incompleteness of each assumption. For example, suppose there is only one person in the organization who has a rare skill needed for the project. An obvious assumption would be that the person will not quit the organization before completing the Project. Ignoring this fact constitutes a potential risk.

Checklist analysis - The carefully prepared checklists in any process are great no-brainer timesavers. Projects in the same organization will more often than not have similarities. As a result, you can develop a risk identification checklist based on the information gathered from a similar set of projects previously performed. Also, if you developed the risk breakdown structure (RBS) in risk planning, the lowest level of the RBS can be used as a checklist.

Diagramming techniques - These techniques use diagrams to identify risks by exposing and exploring the risks’ causes. Here are a few examples:
• Cause-and-effect diagram - A cause-and-effect diagram illustrates how various factors (causes) can be linked to potential problems (effects).
Flowchart diagram - A flowchart depicts how the elements of a system are related to each other and shows the logical flow of a process. By examining the flowchart of a process, the risk management team can identify points of potential problems in the flowchart diagram.
Influence diagram - An influence diagram is a graphical representation of situations that shows relationships among various variables and outcomes, such as causal influences and time-ordering of events. By examining these diagrams, the risk management team can recognize potential problem areas and thereby identify risks.

Documentation reviews - A structured review of the relevant parts of input documents, such as the project scope statement and the project management plan, will definitely help in identifying risks. Furthermore, the knowledge base related to risk management from previous projects can also be used/reviewed.

Information-gathering techniques - To identify risks, you need to gather risk related information. Following are some of the information gathering techniques used in risk identification:
Brainstorming - The goal here is to get a comprehensive list of potential risks so that no risk goes unidentified. The project team, along with relevant experts from different disciplines, can participate in the brainstorming session. Brainstorming is better performed under the guidance of a facilitator or a moderator. You can use the categories of risks or the RBS as a framework to keep the session focused on the issue.
Delphi technique - The goal here is for experts to reach a consensus without biases toward each other. I’m sure you will have no problem recalling a time when a decision was made because somebody (usually higher in the management hierarchy) said so. Contrary to this, the Delphi technique is used to ensure that it is the quality of the information and the argument that are important, not who is saying them. It is more or less like a democracy wherein a person putting forth an argument has to convince everyone rather than expect them to nod their heads because he/she is the boss. A facilitator circulates a questionnaire among the experts to solicit ideas about the risks of the given project. The experts respond anonymously. The responses are compiled and circulated among the participating experts for further evaluation without attaching a name to a response. It might take a few iterations before a general consensus is reached.
Interviewing - This is one of the common methods used for information gathering for risk identification. You interview the appropriate stakeholders and subject-matter experts to gather information that will help identify risks for the project at hand.
Root cause identification - A powerful way to identify risk is to look for anything in the project that might generate a risk. In other words, if you can spot a potential cause for risks, it’s simple to identify the risks resulting from that cause. Furthermore, if you know the cause of a risk, it helps to plan an effective response. You can also look for risks at the opposite side of causes that is, impacts.
SWOT analysis - While root cause identification techniques look into the causes of risks to identify risks, a SWOT analysis looks at the potential impacts of risks to identify risks. If you examine the strengths, weaknesses, opportunities, and threats (SWOT) of a given project, you will be exposing the risks involved. Remember that a strength is an opportunity, a weakness is a threat, and opportunities and threats are posed by risks. This helps broaden the spectrum of risks considered. For example, a strength of your project might be that most of its parts are well understood from previously executed similar projects. Therefore, the risks involved in those parts will be easy to identify. A weakness of your project might be that one of the parts involves new technology that is not well-tested. So, this is a source of unknown risks. An opportunity might be that your organization will be the first one to take this product to market. An example of a threat might be that the government is considering a bill that, if it becomes a law, will have profound implications for your project.

Of course, you can always use the judgment of experts on the topic. You will generally be using more than one of these tools and techniques to identify risks. During risk identification, you might discover the causes of the risks, and you might even think of some potential risk responses. All this is part of the output of the risk identification process.

The Output of Risk Identification - The Risk Register

The risk register is a document that contains the output of the risk identification process. The risk register will be constantly updated with a lot of information from other risk management processes. To begin, you store the following information from the risk identification process in the risk register:
List of identified risks - These are the risks that you identified in the risk identification process. These risks should be described in reasonable detail, which may include the following:
o The risks - The definition and nature of each risk and the causes that will give rise to the risk.
o List of the root causes of the risks - This is a list of events or conditions that might give rise to the identified risks.
o Updates to risk categories - Risks categories were originally identified in the risk management planning process. However, in the process of identifying risks, you might discover new categories or modify existing categories. The updated risk categories must be included in the risk register.
List of potential responses - Risk response planning is a separate process that is performed after risk analysis. However, during risk identification, you might identify potential risk responses that you must document in the risk register. These responses can be further examined and planned in the risk response planning process.

The results of the risk identification process usually lead to qualitative risk analysis. However, depending upon the project and the experience of the risk management team, risk identification might lead directly to quantitative risk analysis and even to risk response planning.

Prev: Planning Risk Management

Next: Analyzing Risks

Wednesday, June 29, 2011

Chapter 50: Planning Risk Management

In the previous chapter, we saw the big picture of risk management and the next step now is to plan for managing risks in our project.
So, lets get started!!!

Planning Risk Management

Risk management planning is the process used to decide how the risk management activities for the project at hand will be performed. The major goals for planning risk management are threefold: Ensure that the type, level, and visibility of risk management are proportionate to the actual risk involved in the project and the importance of the project to the organization; secure sufficient resources, including time for risk management activities; and set up an agreed-upon basis for evaluating risks.
To be more explicit, you use the risk management planning process to determine the following:
• How to approach the risk management activities for this project
• How to plan the risk management activities
• How to execute the risk management activities
The picture below explains the process used for Planning Risk Management:


Developing the Risk Management Plan

You perform risk management planning to develop a document called the risk management plan. As an input to this development process, you need to look at the project scope statement, which contains elements such as the following, which are relevant to risk management planning:
Assumptions and constraints - Assumptions should be evaluated for their uncertainty and thereby the possible risks. Constraints represent fixed parameters, such as available funds and deadlines that can also pose risks to the project.
Project objectives and requirements - You must address the risks that might prevent the team from meeting the project objectives and requirements.
Product description - There might be risks involved in performing the work for meeting the product description.
Initial risk identification - The project scope statement might contain some of the risks you initially identified. Now you have more information to build on that work.
The cost management plan may have information on risks related to budget, contingency, and management reserves. The schedule management plan may have information on how the schedule contingencies will be used and reported. The communication management plan should have information on who should receive reports about the different risks.

The enterprise environmental factors relevant to risk planning include the organizational attitude toward risks and the risk tolerance level of the organization. This information can be found from the policy statements of the organization and from actual experience with previous projects. The organizational process assets relevant to risk planning include organizational approaches toward risk management, definitions of concepts and terms used within the organization, standard risk templates you can use, a roles and responsibilities list, and authority levels for decision making.

You develop the risk management plan by holding planning meetings, which might include the following attendees:
• Project manager
• Selected members from the project team (Usually the team leads and other experienced members of the team)
• Selected stakeholders
• Any member from the performing organization who has responsibility for risk planning and executing

In these meetings, the input items are used to develop the risk management plan, the only output of the risk management planning process.

Risk Management Plan

The only output of the Plan Risk Management process is the risk management plan, which includes the following elements.

Methodology - This specifies the system of approaches, tools, and data sources that will be used to perform risk management on the project at hand. These tools and approaches might vary over projects, so you have to make the best selection for the given project.
Identifying and assigning resources - This identifies and assigns resources for risk management, such as human resources, cost, and time.
Roles and responsibilities - This specifies the roles and responsibilities for each role involved in risk management. These roles are assigned to members of the risk management team. The risk management team might include members from outside the project team.
Budgeting - The cost for risk management activities needs to be estimated and included in the budget and the project cost baseline.
Timing and scheduling - The plan specifies how often risk management processes will be performed and which risk management activities will be included in the project schedule, which is planned and developed by using processes discussed in the chapter on Planning for Project Schedule and Communication.

Risk categories - This element specifies how the risks will be categorized. The risk categories typically correspond to the sources of risks. Depending upon the size and complexity of the project, you might need to develop a risk breakdown structure (RBS), which is a hierarchical structure that breaks the identified risk categories into subcategories. In developing this structure, you will end up identifying various areas and causes of potential risks. The performing organization might already have prepared a categorization of typical risks. However, you need to examine this categorization for each project and tailor it according to the needs of the project at hand. The risk categorization helps you identify risks to the extent that you will be identifying various areas and causes of potential risks for your project.

Risk probability and impact - Defining different levels of risk probabilities and impacts is necessary to ensure the quality and credibility of the qualitative risk analysis that we will discuss in just a bit. The basic issues are defining the scale of likelihood that the risk will happen and defining the scale of the strength of its impact if the risk occurs. These definitions, even if they already exist in the organization, must be examined and tailored to the needs of the specific project.

You can define the risk probability scale from very unlikely to almost certainly, called the relative scale. As an alternative, you can define a numerical scale in which the probability is represented by numbers, in which a value close to 0.0 means very unlikely and a value close to 1.0 means almost certainly. The impact scale represents the size of the risk impact on the given project objective should the risk occur. Just like the probability scale, you can define the impact scale relatively or numerically. The relative scale can range from very low impact to very high impact, with points in the middle such as low, moderate, and high. As an alternative, you can define the impact numerically; it might be linear, such as the first point at 0.1, the second point at 0.2, and the tenth point at 1.0, or it might be nonlinear, such as the first point at 0.001, the second point at 0.01, and the third point at 0.1.

Look at the picture below for a simple example: It shows an example of linear and nonlinear impact scales, in which the impact scale for Objective 1 is nonlinear and the impact scale for Objective 2 is linear. You can think of the X axis as a variable on which the risk impact depends.


Risks are prioritized according to the size of their impact on the project objectives, which can be recorded in what is called an impact matrix or lookup table. Even if your organization already has a typical impact matrix, you should examine it and tailor it to the needs of the specific project at hand. I will discuss the probability and impact matrix in more detail later in this chapter.

To understand the risk impact better, lets look at a sample that defines the impact of risks on the various project objectives.

Project Objectives Very Low (0.05) Low (0.10) Moderate (0.35) High (0.65) Very High (0.90)
Time Insignificant time increase 1-10% time increase 10-30% time increase 30-60% time increase 60-100% time increase
Cost Less than 1% cost increase 1-20% cost increase 20-50% cost increase 50-80% cost increase 80-100% cost increase
Scope Scope decrease unnoticeable Scope of only a few minor areas affected Sponsor approval necessary for scope reduction Scope reduction unacceptable to the sponsor Project and item are effectively useless
Quality Unnoticeable quality reduction Only a few applications will be affected Quality requires sponsor approval Quality reduction unacceptable Project and item are effectively useless
A point to note is that, this example shows only the negative impact.

Risk reporting and tracking - This element describes the format of risk reports, such as the risk register, a document that contains the results of risk analysis and risk response planning. Furthermore, it describes how different aspects of risk activities will be recorded so that the risks can be monitored for the current project. Also, should the performing organization decide to audit the risk management process, one should be able to track these activities. Another reason for recording these activities could be to save the information for the benefit of future projects in the form of lessons learned.

During the process of planning risk management for a specific project, you revisit the tolerance levels of the stakeholders for certain risks, and these levels may be revised. Risk management planning is the process that generates the risk management plan document, which contains the information that will be used in risk identification, risk analysis, and risk response planning.
You cannot manage a risk if it’s not identified. Dont worry, thats going to be the next chapter.


Prev: Big Picture of Risk Management

Next: Identifying Risks

Thursday, June 23, 2011

Chapter 49: The Big Picture of Risk Management

The word Risk signifies or means Danger and our perception is that, whenever it happens, the result will be negative or something undesirable. That’s the general description but we are preparing for PMP and what the PMI says matters!!!

According to PMI

Risk is an uncertain event or condition that if occurs, has a positive or negative effect on meeting the project objectives related to components such as schedule (time), cost, scope or Quality.

For example, one of the obvious schedule objectives for a project is to complete the project by the scheduled deadline. If a risk related to the schedule occurs, it can delay the completion of the project, or it can make it possible to finish the project earlier. So, the two characteristics of a risk in project management are the following:

• It stems from elements of uncertainty.
• It might have negative or positive effects on meeting the project objectives.

Risk management includes planning risk management, identifying and analyzing the risks, preparing the response plan, monitoring the risk, and implementing the risk response if the risk occurs.

Look at the picture below that explains the big picture of Risk Management


The picture above shows the corresponding processes used to accomplish these tasks, which are also explained below:
Plan Risk Management - A process to determine the how of risk management: how to conduct risk management for the project at hand.
Identify Risks - A process to identify and document the risks that might occur for a given project.
Perform Qualitative Risk Analysis - A process used to estimate the overall probability for risks to occur and their impact and to prioritize them accordingly for further analysis.
Perform Quantitative Risk Analysis - A process used to analyze numerically the effect of identified risks on meeting the project objectives.
Plan Risk Responses - A process used to prepare a risk response plan in order to increase the positive impact and decrease the negative impact of risks on the project.
Monitor and Control Risks - A process used for tracking identified risks, identifying new risks, executing risk response plans, and evaluating the effectiveness of executing responses throughout the lifecycle of the project.

The risk monitoring and control process is part of the control process group; therefore, we will discuss them later while discussing Monitoring and Controlling Quality and Risk. The other five processes will be discussed in the next few chapters.

Trivia:
The data flow between the different processes as shown in the picture above is true in general. However, a point to note is that, depending upon the project and the experience of the risk management team, shortcuts can be taken. For example, you can go directly from risk identification to quantitative risk analysis, or even to risk response planning depending on how comfortable you are with respect to these tasks.

Prev: Planning Quality

Next: Planning Risk Management

Chapter 48: Planning Quality

In the previous chapter, we saw the importance of planning for a projects quality. We saw a high level overview of how quality management happens in an organization but we haven’t jumped into the details yet. Well, this is the chapter where we jump into the ocean.

So, lets get started!!!

What is Quality?

According to PMBOK, quality is defined as the degree to which a set of characteristics of project deliverables and objectives fulfill the project requirements. Therefore, any characteristic that influences the satisfaction of the stakeholders is included in determining the quality. The project quality management processes include performing quality planning, quality assurance, and quality control. Quality planning is the quality process that is performed during the planning phase to accomplish the following goals.

• Identify which quality standards are relevant to the project at hand
• Determine how to satisfy these standards

The picture below explains this process:


Input to Quality Planning

The key input items for this phase of quality planning are:
Project performance baseline - The project performance baseline constituted by the scope baseline, schedule baseline, and cost baseline contains the list of all the deliverables and objectives to which the quality needs to be applied. For example, the following components of the project scope statement are especially relevant to quality planning:
• Project deliverables.
• Project objectives.
• Project requirements.
• A product scope description that may contain the details of technical issues and other quality-related concerns.
• Product acceptance criteria. The definition of acceptance criteria has an impact on the quality cost.

You find out the accepted schedule performance from the schedule baseline and the accepted cost performance from the cost baseline.

Stakeholder register and risk register - The stakeholder register may help in identifying the stakeholders that will have interests in quality. The risk register will help identify positive risks (opportunities) and negative risks (threats) that may have impact on deliverable quality.

Enterprise environmental factors - Guidelines, regulations from a government agency, rules, and standards relevant to the project at hand are examples of enterprise environmental factors that must be considered during quality planning. For example, procedures relevant to the application area of this project should be followed. Working or operating conditions and environment can also affect the project quality.

Organizational process assets - The following organizational process assets can affect the project from the perspective of quality planning:
• Information from previous projects and lessons learned
• Quality-related historical database
• An organizational quality policy, which is composed of overall intentions and high-level direction of an organization with respect to quality, established by the management at executive level

If the performing organization lacks a quality policy, the project team will need to develop a quality policy for the project. Once a quality policy is in place, it is your responsibility to ensure that the project stakeholders are aware of it and are on the same page.

Tools and Techniques Used for Quality Planning

The tools and techniques used for quality planning include benchmarking, cost/benefit analysis, experiment design, and brainstorming.

Benchmarking - Benchmarking is comparing practices, products, or services of a project with those of some reference projects for the purposes of learning, improving, and creating the basis for measuring performance. These reference projects might be previous projects performed inside or outside of the performing organization. Improvement and performance are of course quality-related factors. For example, you might have a similar project performed in the past that accepted no more than two defects in each feature. You might use that as a quality criterion or simply put a benchmark for your project.

Cost of quality and cost/benefit analysis - The cost of quality is the total quality-related cost during the lifecycle of the product. That includes the costs incurred in implementing conformance to the requirements, reworking due to the defects resulting from failure to meet the requirements, and updating the product or service to meet the requirements. The cost of performance consists of prevention costs and appraisal costs. Prevention costs include the costs of appropriate equipment, documenting and performing processes, time and effort to perform the project work the right way, and needed training of the team members. The appraisal costs include the costs of inspecting, testing, and loss due to destructive testing. Cost of nonconformance includes rework and waste of time and effort if the product is rejected internally because it did not meet the quality standards. If the problems with the product were found by the customer, however, the results could be more much more costly and damaging, including liabilities and loss of business.

During quality planning, you must consider the tradeoff between the cost and the benefit of quality and strike the appropriate balance for a given project. Implementing quality has its costs, including quality management and fulfilling quality requirements. The benefits of meeting quality requirements include less rework, resulting in overall higher productivity; lower costs of maintaining the product or service; and higher customer satisfaction.

Experiment design - Also called design of experiments (DOE), this is a statistical method that can be used to identify the factors that might influence a set of specific variables for a product or a process under development or in production. You look for optimal conditions by changing the values of a number of variables simultaneously rather than changing one variable at a time. By using the results from this technique, you can optimize the products and processes. For example, you can use DOE to strike the right balance between cost of quality and its benefits. During planning, DOE can also be used to determine the types of tests and their impact on cost of quality.

Other quality planning tools - Other tools that you can use in quality planning, depending upon the project, include brainstorming, flowcharting, control charts, and statistical sampling. Statistical sampling involves randomly selecting a part of the population for study. Control charts, flowcharting, and statistical sampling will be covered in great detail in future when we discuss Quality Control. Some other tools of quality planning are:
Affinity diagrams - A business tool used to organize a large set of data and ideas into logical groups based on the relationships among these ideas.
Force field analysis - A technique to understand the forces (factors) influencing a situation. It can be used to separate the forces that drive movement toward a goal from those that either block that movement or drive it away from the goal.
Matrix diagrams - This method is used to explore the relationships between different entities, such as objectives and causes, by displaying these entities in a matrix, with cells of the matrix representing the relationships.
Nominal group techniques - These are the decision-making methods that are used among groups of different sizes with two goals in mind: Make the decision quickly and take everyone’s opinion into account. One example involves decision making by a group of one size, then a review of all those ideas from brainstorming by a group of another size, and then making the final decision by a group of yet another size.
Prioritization matrices - This is the method of prioritizing entities, such as problems, ideas, and issues, by using some ranking criteria.

Output of Quality Planning

The outputs of the quality planning process are:

Quality management plan - The quality management plan describes how the quality policy for this project will be implemented by the project management team. It includes approaches to quality assurance, quality control, and continuous process improvement. The quality management plan also contains the quality baseline that sets the criteria that specify the quality objectives for the project and thereby makes the basis for measuring and reporting quality performance. For example, a project that is finished on time, with everything delivered in scope, and that stayed within its cost is a project with high quality performance.
This plan becomes a component of the overall project management plan.

Quality metrics - This is an operational criterion that defines in specific terms what something (such as a characteristic or a feature) is and how the quality control process measures it. For example, it is not specific enough to say the defects in the product will be minimized. Rather, specifying something such as that no feature will have more than two defects is a measurable criterion and hence a metric. Some examples of quality metrics are cost performance, schedule performance, defect frequency, failure rate, and test coverage. The metrics that you set during quality planning will be used in quality assurance and quality control.

Quality checklist - A checklist is a structured tool used to verify that a predetermined set of required steps has been performed. The checklists can come in imperative form (“to do” lists) or in interrogative form ("have you done this" lists). Checklists are prepared during quality planning and used during quality control.

Process improvement plan - This plan describes how to improve some of the processes that will be used in the project. For example, one purpose of improvement is to prevent activities in the processes that are not needed for this project. This is accomplished by describing the purpose, start, and end of a given process, the input to the process, and the output of the process. This is equivalent to drawing boundaries around the process. The process improvement plan may also include some metrics used to measure the efficiency of the process.

Updates to project documents - During quality planning, you may end up making changes that will require modifying corresponding documents, such as the stakeholder register and responsibility assignment matrix (RAM).

Prev: Big Picture of Quality Management

Next: Big Picture of Risk Management

Chapter 47: Big Picture of Quality Management

Quality refers to the degree to which a set of characteristics of project deliverables and objectives fulfills the project requirements. In other words, it is the sum of project and product characteristics that help fulfill the requirements.

Simply put – Does the project or product meet its requisite purpose properly? If so, we can consider our product/project to be of good quality.

The broader goal of quality management is to ensure that a given project will satisfy the needs for which it was undertaken.

Quality management has two components:
1. Project quality management and
2. Product quality management.

While product quality management techniques depend upon the specific product that the project is going to produce, project quality management applies to all projects independent of the nature of the products.

While dealing with quality, you should be able to distinguish between the terms in the following pairs:
Grade and quality - Grade is a category assigned to products with the same overall functional use but that differ in their technical characteristics and features, whereas quality is the degree to which the inherent characteristics of a product meet the requirements. Number of defects is an example of poor quality, whereas a limited number of features is an example of low grade.
Precision and accuracy - Precision is a spread of different measurements of the same quantity, constant, or variable, such as gravity or cost. The smaller the spread of measured values, the better the precision. Accuracy is a measurement of how close the measured values are to the true value of the quantity. The closer the measured value is to the actual (or true) value, the better the accuracy of measurements.
Prevention and inspection - Prevention is a direction to perform an activity that will keep an error from entering the product and the process. Inspection is a technique to examine whether an activity, component, product, result, or service complies with planned requirements. So, the goal of inspection is to ensure that errors do not reach the customer.

Trivia:
PMI’s approach to quality management is intended to be compatible with that of International Organization for Standardization (ISO) and is compatible with proprietary approaches to quality, such as those proposed by Crosby, Deming, Juan, and others. It is also compatible with proprietary approaches to quality management, such as continuous improvement, cost of quality (COQ), design reviews, failure mode and effect analysis (FMEA), Six Sigma, Total Quality Management (TQM), and the voice of the customer.

Project management and quality management have come a long way as separate disciplines of knowledge and practice. It should not come as a surprise that quality management is one of nine knowledge areas in standard project management. In a complementary way, both modern quality management and project management recognize the importance of the following critical points:

Continuous improvement

Continuous improvement means continuing to improve the quality through a process of planning for quality, implementing quality, auditing quality, and re-planning based on lessons learned or auditing. So really, quality improvement is an endless cycle, called a plan-do-check-act cycle as defined by Shewhart and modified by Deming. Performing organizations can also use techniques such as Six Sigma and TQM to improve the quality.
Trivia:
Methodologies like Six Sigma and ITIL are based on this concept of continuous improvement

Customer satisfaction

Customer satisfaction can be a very vague notion that can mean different things to different parties. However, in project management and quality management, customer satisfaction means planned customer requirements are met. To achieve customer satisfaction in the real world, you need to understand, define, and evaluate the customer expectations and also manage those expectations, in addition to meeting the planned requirements. Otherwise, you might meet the planned requirements, and the customer may still be dissatisfied.

Trivia:
Customer Satisfaction is one of the key performance indicators for any project manager. A good project manager will not only deliver a good quality work product but also meet or strive to always exceed customer expectations and keep the customer happy and satisfied always. After all, Customer is King in any business.

Management responsibility

This refers to the responsibility of management to provide resources needed for the project team to succeed. Although all team members should be responsible for the success of their parts of the project, they cannot succeed without management responsibility.

Trivia:
A project team cannot deliver a product without the requisite logistics. A workstation, a server, a database and a network are all mandatory requirements for any product and it’s the responsibility of the management to provide these to their team members in order for the team to deliver the work.

Prevention over inspection

One of the fundamental tenets of modern quality management is plan, design, and build in quality as opposed to inspect in. The cost of preventing mistakes is much less than finding them through inspections and then fixing them. Therefore, cost of quality (COQ) is less in prevention than through inspection. The COQ is defined as the total cost of quality-related efforts throughout the product lifecycle.

Trivia:
The age old saying “Better Safe Than Sorry” speaks volumes.

Look at the image below to understand the high level quality management process:


The Quality Management process explained in the picture above has the following processes:

Plan Quality - This process is used to identify which quality requirements and standards are relevant to the project at hand and to determine how to meet these requirements and standards, as well as how compliance to the quality requirements will be demonstrated.
Perform Quality Assurance - This process is used to audit the fulfillment of quality requirements to ensure that the project employs all the planned quality requirements and standards.
Perform Quality Control - This process monitors project results to ensure that they meet the agreed-upon quality standards and identifies ways to eliminate the factors that keep the project results from meeting standards—that is, to make recommendations for changes or actions.

The processes for quality assurance are used as part of executing the project, and quality control is used as part of monitoring and controlling the project. These processes are therefore discussed in forthcoming chapters. Quality planning is performed during the project planning stage and so we will cover that next.

Prev: Introduction to Quality & Risk Management

Next: Planning Quality

Chapter 46: Introduction to Quality & Risk Management

Till now we have covered how to plan for a project scope, project resources and project procurement. The next planning we need to do is “Planning the Projects Quality & Risk”. In the next few chapters, we will be covering these in details.

So, lets get started!!!

Why Quality & Risk Management is Essential?

Quality and risk are two important interrelated aspects of any project that need to be managed. While quality refers to the degree to which a set of characteristics of project deliverables and objectives fulfill the project requirements, risk refers to an uncertain event or condition that, if it occurs, has a positive or negative effect on meeting the project objectives.

Consider the following two scenarios:

Scenario 1:

Your project just went live. You have created an online banking website for some bank in America and the website is live. As soon as customers start using the website, it is frequently crashing, customers are not able to view their account balance or perform fund transfer. All in all, the website isn’t meeting its required objectives. What went wrong here?

There was no quality management done. The quality of the work product delivered to the customer isn’t up to expectations and hence it’s a total disaster.

Scenario 2:

Lets say, you are on your way to deliver a major online banking website for a large bank in America. You are midway through the project and suddenly your Technical Lead has resigned. He was the center point for all technical discussions in the project and his departure is going to leave a big void and now people are worried that we may not be able to finish the project. What went wrong here?

There was no risk management done. Every project has its own set of inherent risks that may delay the project delivery and if we fail to plan for such risks, the project will be a total disaster.

After you have planned the project scope to the WBS level, as discussed in the previous chapters, you are ready to plan the quality and risk management. After the project starts executing, you will not have enough time to plan a response to a risk if it occurs, so you need to plan risk responses before the project starts executing. To do that, you need to identify the risks and analyze them.

So, the main things we will learn in this section are:
1. How do you plan for quality and risk management?
2. Learn how to plan quality
3. Identify and analyze risks
4. Plan risk responses.

This chapter is just an introduction and we will jump into the details in the subsequent chapters.

Prev: Important Terms - Project Resource Planning

Next: Big Picture of Quality Management

Monday, June 20, 2011

Important Terms and Definitions - Project Resource Planning

We have successfully completed all the topics in the section on “Planning for Project Resources”. Let us wrap up the section by going through the important terms and definitions we learnt in these chapters.

Budget - Aggregation of cost estimates with a timeline assigned to it.
Contingency reserve - Funds or time reserved in addition to the calculated estimates to deal with the uncertainties in the duration used in the schedule and the cost used in the budget and to deal with overruns of the project objectives to meet the stakeholder expectations.
Contract - A mutually binding agreement between a buyer and a seller that obligates the seller to provide the specified product, service, or result and obligates the buyer to make the payment for it.
Cost baseline - Approved budget used as a baseline to determine the project progress.
CPFF - Cost plus fixed fee; a contract type.
CPIF - Cost plus incentive fee; a contract type.
CPPC - Cost plus percentage of cost; a contract type.
FP - Fixed price; a contract type.
Human resource plan - A document that describes roles and responsibilities, reporting relationships among the roles, and staffing management.
Procurement management plan - A document that describes how procurements will be managed.
Procurements - Purchases and acquisitions that are needed to complete the project but that cannot be produced by the in-house project team.
RAM - Responsibility assignment matrix; a matrix used to specify the relationships between schedule activities, roles to perform those activities, and team members assigned to the roles.
Role - A defined function to be performed by a team member, such as a programmer or a tester.
Staff management plan - A document that describes when and how human resource requirements for a project will be met.
T&M - Time and material; a contract type.


Prev: Procurement Management Plan

Next: Introduction to Quality & Risk Management

Chapter 45: Procurement Management Plan

In the previous chapter, we learnt that the outcome of the procurement planning process is the procurement management plan. In this chapter, we are going to understand what this document is.

So, lets get started!!!

What is Procurement Management Plan?

This document describes how the procurement will be managed throughout the project. The plan includes the following:

• How the make-or-buy decisions will be made and handled
• Contracts
o What types of contracts will be used for this project
o The form and format for the statement of work related to a procurement or a contract
o Metrics to be used to evaluate potential sellers and to manage contracts
o Requirements for performance bonds or insurance contracts that might be put in place to mitigate some project risks
• Management and coordination
o How to manage multiple sellers.
o How to coordinate procurement with other aspects of the project, such as the project schedule, scope, budget, and status progress reporting.
o Evaluation criteria for selecting sellers and measuring their performance. It is also called source selection criteria and will be covered in depth in future when we learn about conducting the actual procurements.
• A list of assumptions and constraints that could affect the procurement
• Any needed standardized procurement documents

In a nutshell, the major tasks of procurement planning are making make-or-buy decisions, preparing the procurement management plan, preparing the statement of work, determining a suitable type of contract, and preparing or acquiring the procurement documents. Once you have these elements in place, you are ready to implement the procurement plan, which will be discussed very soon…

Prev: Procuring Project Resources

Next: Important Terms & Definitions

Chapter 44: Procuring the Project Resources

In the previous chapters, we have identified how many people are required to work on our project and the amount of money we can spend on the project. But, it frequently happens that we don't have all the necessary expertise to complete a project by the resources within our organization. In such a case, we may have to procure the services from a third party service provider. A simple example will be procuring Weblogic Servers to run the in-house web applications we are developing for our company. In this chapter, we are going to take a look at how we are going to handle procurement management as a process.

So, lets get started!!!

What is Procurement and Procurement Management?

Procurement refers to obtaining; purchasing or renting products, services, or results from outside the project team to complete the project. Accordingly, procurement management is an execution of a set of processes used to obtain (procure) the products, services, or results from outside the project team to complete the project. There are two main parties involved in procurement management:

• Buyer - The party purchasing (procuring) the product or service.
• Seller - The party delivering the product or service to the buyer.

To understand the process, look at the picture below:


As illustrated in the picture above, procurement management includes the following:

• Plan procurements - This is the process of making and documenting purchasing decisions, identifying potential sellers, and determining the approach toward these issues.
• Conduct procurements - This is the process of soliciting seller responses, selecting sellers, and awarding contracts.
• Administer procurements - This is the process of monitoring the contract execution, making approved changes and corrections, and managing relationships among the parties involved in the procurement.
• Close procurements - This is the process of completing each project procurement and giving it a proper closure as planned.

Planning for Procurement

Planning procurements includes making and documenting purchasing decisions, identifying potential sellers, and developing a procurement approach. Although the procurement planning should be done early in the project, like any other planning, it might be necessary at any stage of the project as the need arises due to approved changes or other circumstances.
Procurement is planned by performing the Plan Procurements process.


As shown in the picture above, during procurement planning, you will be looking at lots of information, such as the scope baseline, stakeholder requirements, partner agreements, risk registers, activity resource requirements, and cost baseline. All this information will help you identify what needs to be done to complete the project, what the risks involved are, and what needs to be procured. Enterprise environmental factors, such as market conditions, availability of the product in the market, past performance of potential suppliers, and unique local conditions, must be considered as input to this process. The organizational process assets that can influence procurement planning include procurement policies and procedures of the performing organization, a supplier system of already established sellers that the organization currently deals with, and an information system that can be used to develop the procurement management plan. You will also need to know how to make make-or-buy decisions and what the different contract types are.

Make-or-Buy Decisions

Obviously, procurement refers to buying something as compared to making it in-house. The decision to buy or make can be based on one or more of the reasons explained below:

Factor Reasons to make it In-House Reasons to Buy
Cost Less cost Less cost
Skills availability Use in-house skills In-house skills don’t exist or are not available
Skills acquisition Learn new skills that will be used even after this project These skills are not important to the organization
Risks Deal with the risk in-house Transfer the risk
Work Core project work Not core project work
Human resource availability Staff available Vendor available
Buy can mean to purchase or to rent. The decision to purchase or to rent should be based on the effective cost in the long term. For example, if it is a piece of hardware that will be used only in this project, you do not anticipate its use in any future project, and renting is significantly cheaper than buying, you should probably rent it. You might decide to buy it if this hardware is of common use in the kind of work your organization does and therefore it will be used in other projects as well.

Trivia:
An output of the procurement planning process is the statement of work (SOW), which is a document summarizing the work to be performed. The SOW can be written by the buyer or the seller to specify what products will be delivered or what services will be performed. It is also called the contract statement of work.

Before you can buy, you need to get information from the sellers. In other words, you need to request seller responses. Make-or-buy analysis is a technique used in the plan purchases and acquisitions process. Also in this process, you need to use a technique to determine the type of contract you will use for the procurement.

Trivia:
Making a decision of choosing the vendor to procure the service is not usually in a project manager’s hand. We can try to influence the project sponsor to choose a certain vendor but ultimately it is their decision. And almost always, the cost at which the vendor offers the service is one of the overwhelming factors that affect the decision by the project sponsor.

Determining Contract Types

A contract is a mutually binding agreement between a buyer and a seller that obligates the seller to provide the specified product, service, or result and obligates the buyer to make the payment for it. Contracts generally fall into the three categories discussed in this list.
Fixed-price contracts - A fixed-price contract, also called a lump-sum contract or a firm fixed-price contract or a fixed-bid contract, is an agreement that specifies the fixed total price for the product, service, or result to be procured. An example of a fixed-price contract is a purchase order for the specified item to be delivered by a specified date for a specified price. This category of contracts is generally used for products and services that are well-defined and have good historical information. A fixed-price contract for a poorly defined product or a service with very little historical record is a source of high risk for both the seller and the buyer.

Cost-reimbursable contracts - A contract in this category includes two kinds of costs:
• Actual cost - This is the payment (reimbursement) to the seller for the actual cost of the item, which includes the direct cost and the indirect cost (overhead). An actual cost, such as the salary of the project staff working on the item, is incurred directly from the work on the item, whereas an indirect cost, such as the cost of utilities and equipment for the office of the staff member, is the cost of doing business. Indirect cost is generally calculated as a percentage of the actual cost. The actual cost is also called the project cost. The project here refers to the project of the seller to produce the items for the buyer.
• Fee - This typically represents the seller’s profit.
As discussed in the following list, there are three types of cost-reimbursable contracts:
• Cost plus fee (CPF) or cost plus percentage of cost (CPPC) - The payment to the seller includes the actual cost and the fee, which is a percentage of the actual cost. Note that the fee is not fixed; it varies with the actual cost.
• Cost plus fixed fee (CPFF) - The payment to the seller includes the actual cost and a fixed fee, which can be calculated as a percentage of the estimated project cost. Note that the fee is fixed and does not vary with the actual project cost.
• Cost plus incentive fee (CPIF) - The payment to the seller includes the actual cost and a predetermined incentive bonus based on achieving certain objectives.

Trivia:
Both fixed-price contracts and cost-reimbursable contracts can optionally include incentives; for example, a bonus from the buyer to the seller if the seller meets certain target schedule dates or exceeds some other predetermined expectations.

Because cost overrun can occur in any type of cost-reimbursable contract, and the cost overrun will be paid by the buyer, this category of contract poses risk to the buyer.

Time and material (T&M) contracts - This type of contract is based on the rates of time and materials used to produce the procured product. This is a hybrid that contains some aspects from both the fixed-price category and the cost-reimbursable category. The contracts in this category resemble the contracts in the cost-reimbursable category because the total cost and the exact quantity of the items is not fixed at the time of the agreement. The contracts resemble fixed-price contracts because the unit rates can be fixed in the contract. These types of contracts are useful when you do not know the quantity of the procured items. For example, you do not know how much time a contract programmer will take to develop a software program, so you determine the hourly rate in the contract, but not the total cost for writing the program. In this category of contracts, the risk is high for the buyer because the buyer agreed to pay for all the time the seller takes to produce the deliverables.

Before we wrap up this chapter, lets take a look at who bears the risk in these different types of contracts we just discussed.

Contract Type Risk Bearer Justificiation/Explanation
Fixed price (FP) Buyer and seller The cost overrun is borne by the seller, whereas the price fixed higher than the actual cost hurts the buyer.
Time and Material (T&M) Buyer The increased cost due to the increased quantity of resources, such as work hours by a contractor, is borne by the buyer.
Cost plus fixed fee (CPFF) Buyer Cost overrun is paid by the buyer.
Cost plus percentage of cost (CPPC) Buyer Cost overrun is paid by the buyer. Because the fee increases with the increase in cost, this type poses maximum risk to the buyer.
Cost plus incentive fee (CPIF) Buyer Cost overrun is paid by the buyer.
The major output of procurement planning is the procurement management plan which outlines the plan with which the process of Procurement of services for our project will be managed. We will cover this exclusively in the next chapter.

Prev: Estimating Costs & Determining Budgets

Next: Procurement Management Plan

Chapter 43: Estimating Costs and Determining Budgets

In the previous chapter we learnt how to create the project human resource plan. To get resources you need to spend money (Cost) and you cant spend an infinite amount. Every project has certain limits on the amount of money you can spend (Budget). In this chapter, we are going to learn about estimating the costs and determining the budget involved in a project.

So, lets get started!!!

Difference Between Cost & Budget:

Many people confuse the terms cost & budget and even use them interchangeably. Unfortunately they are both not the same. So, the first thing we need to do is, understand clearly the difference between cost and budget.

Cost is the value of the inputs that have been (or will be) used up to perform a task or to produce an item: product, service, or result. This value is usually measured in units of money. For example, you paid two programmers Rs. 5000/- each for developing a software program, and you paid Rs.1000/- to a tester to test the program. So, the cost for the task of developing and testing the software program is Rs. 11,000/-. You can add the costs of components of a system, and the sum will represent the cost of the system, but it’s still a cost and not a budget.
Budget is an aggregated cost with a timeline. You aggregate the costs of all the resources needed to perform the project and put a timeline on it: the availability of funds over time. That is called a budget.

Look at the image below:


Cost management consists of estimating project costs, determining budget from the cost estimates, and controlling the cost while the project is being executed. This is just a high level depiction of cost management and we will cover the details now.

Estimating Project Costs

Estimating project cost means developing an estimate for the monetary resources needed to complete the project work; that is, activities. These estimates are based on the information available at a given time. The estimates in the beginning are less accurate; for example, their accuracy may be only as good as + or - 50 percent. For example, if you say the cost will be $50,000, it could be anywhere between $25,000 and $75,000. As the project moves along and more information becomes available, the cost estimates can be improved to get better estimates.
The standard process used to estimate costs is called the Estimate Costs process. Look at the image below:


Estimating project cost means estimating the costs required to complete the project scope by executing schedule activities. Therefore, you need the scope baseline and the schedule baseline for estimating costs. Recall that the scope baseline is constituted by the scope statement, the WBS, and the WBS dictionary, and the schedule baseline is the approved project schedule. The list of items used as input to this process are:
• Human resource plan - The information in the human resource plan useful for estimating costs includes the list of roles and responsibilities, personnel rates, and recognitions and rewards.
• Project schedule - An approved project schedule will give you the information about the resources needed to complete the project work. This information is crucial to make cost estimates. As you learned in the previous chapter, activity resources are estimated by performing the Estimate Activity Resources process. Therefore, the Estimate Costs process should be closely coordinated with the Estimate Activity Resources process, which in turn depends on the Estimate Activity Durations process because activity duration is determined for the given resources.
• Scope baseline - All three components of the scope baseline; scope statement, WBS, and WBS dictionary are useful in estimating the project cost. The scope statement will provide the cost-relevant information, such as project and product acceptance criteria, assumptions and constraints, product description, key deliverables, and project boundaries around the scope.
• Risk register - Both kinds of risks—threats and opportunities have an impact on the cost in the form of risk mitigation costs and revenues or savings from the opportunities.
• Enterprise environmental factors - Enterprise environmental factors relevant to estimating costs include market conditions and published commercial information that will provide the cost of resources, including human resources, materials, and equipment. This will also provide the information related to the availability of products and services and their cost and rates. Supply and demand conditions can also influence the project cost.
• Organizational process assets - This includes the organization’s policies regarding cost estimates, cost estimating templates, and information from previous projects, including lessons learned.

Tools & Techniques used in Cost Estimating

Some tools and techniques that can be used in cost estimating and budgeting are:
Analogous estimation - Analogous cost estimation is a technique that uses cost-related variables, such as rate, cost of a component, cost of an activity from similar tasks and activities in previous projects, or cost of a similar project from the past, to measure the same variable in the current project. This technique is useful when very limited component information is available, especially in the beginning of a project, and is usually used for estimating the gross values and not the detailed component-based values. It’s generally less costly and less time consuming than other techniques, but it also is less accurate. Its accuracy and reliability improve if the person making the estimate is an expert and the components or activities being compared are actually similar.

Parametric estimation - This is a technique that uses some parameters and statistical relationships among them to make the estimate. For example, if the unit cost is known, say from historical data, the cost of the whole package containing a number of units can be calculated. This technique can generate quite accurate results depending on the accuracy of the quantity of resources and other data that goes into the estimation.

Bottom-up estimation - This technique involves estimating the cost of the parts of a component and then aggregating the cost of those parts to calculate the cost of the whole component. This technique can generate accurate results when you can generally make a better estimate of a part than the whole, which is usually the case when enough information is available.

Contingency reserve analysis - The following two problems are associated with the estimates:
• Estimates are approximations, and approximations imply uncertainty, which means risk.
• Some stakeholders will always push the envelope on the project scope, and each organization has some tolerance for overrunning the objectives. This will mean more cost.

You will need some funds to deal with both of these situations. What comes to your rescue here is called contingency reserve. The contingency reserve, in general, is an amount of resource (funds or time) allocated in addition to the calculated estimates to reduce the risk arising from various sources—for example, from the overruns of project objectives to a level acceptable to the performing organization. In other words, the contingency reserves are the funds reserved to deal with events that are anticipated but not certain. Contingency reserves can be used at the discretion of the project manager. The overall cost estimate should include the contingency reserves.

Vendor bid analysis - Bids from qualified vendors on parts of the project or even the whole project can help in estimating the project cost.

Cost of quality - Cost of quality, should also be considered when making cost estimates. Don't worry about Cost of quality just yet. We will cover it in one of the subsequent chapters.
Three-point estimates - Three-point estimates, discussed in the previous chapter for duration estimates, can also be applied in the same way to cost estimates.

Trivia:
Note that the accuracy of cost estimates depends on many other estimates, such as activity duration estimates and resource requirement estimates, which go into developing the schedule baseline used for making cost estimates. It is important to keep this dependency in mind just in case you need to change any of these estimates.

Output of Estimate Costs Process

The output of the Estimate Costs process consists of:
Activity cost estimates - These are the quantitative estimates of various costs required to complete the project work. Depending on the project and the stage of the project, cost estimates may be documented in summary form or in detail. These estimates include costs for all resources needed to complete the project work, including equipment, facilities, information technology, labor directly applied to the project work, material, and services. Indirect costs and special categories, such as allowances and contingency reserves, must also be included.

Estimate bases - It’s important to document what the bases of the cost estimates were. These may highly depend on the application area of the project. At a higher level, the following elements must be included in the documentation:

• Assumptions made in making the estimates; for example, the labor rate and where this data came from.
• Constraints that affected the estimates; for example, a milestone must be met by a certain date.
• The methods used to develop the estimate; for example, a three-point estimate.
• The uncertainty, such as +10%, and the confidence level must be assigned to an estimate.

In a nutshell, the outcome of estimating costs will include a cost estimate for each project activity and the basis for that estimate, which can be used to determine the project budget.

Determining Project Budget

Determining the project budget is the process of aggregating the cost estimates for all project activities and assigning a timeline to them. Cost aggregation is the technique used to calculate the cost of a whole by summing up the costs of the parts of which the whole is made. You can use the bottom-up estimation technique to aggregate the costs of all the components and activities to calculate the total cost of the project. The timeline assigned to this cost will be important to reconcile the expenditure with the funding limits. The reconciliation may require rescheduling some activities.

The budget is determined by using the Determine Budget process. Look at the picture below:


Most of the items in the input to this process are already described in this chapter. Organizational process assets may include organizational policies and tools for determining the budget. The reserve analysis at budget level includes management reserve in addition to contingency reserve, and you must understand the difference between the two. Contingency reserves are the funds that can be used to deal with the unplanned events that can potentially transpire in case one or more identified risks occur, whereas management reserves are the funds that can be used in case of yet unplanned but future changes in some aspects of the project, such as the project scope.

The approved budget that includes the aggregated cost with timeline is called the cost baseline. The cost performance of the project is monitored, measured, and controlled against this baseline. This is why it’s also called the cost performance baseline. Funding requirements for the project are derived from the cost baseline and the reserve analysis.

Do not leave out the cost of the internal employees of the organization who will work on the project. They are not free, for two reasons: The organization pays for them, and they do not have infinite numbers of hours to put into the project. Their cost to the project will be determined just like any other project role based on the hours of work they will put into the project.

In the process of determining the budget, you may need to update the project schedule, cost estimates, and the risk register.

Your organization may not have the resources to complete all parts of the project. For those parts of the project, you will need to use what is called procurement.

Prev: Developing the Human Resource Plan

Next: Procuring the Project Resources
© 2013 by www.getpmpcertified.blogspot.com. All rights reserved. No part of this blog or its contents may be reproduced or transmitted in any form or by any means, electronic, mechanical, photocopying, recording, or otherwise, without prior written permission of the Author.

Followers

Popular Posts